






Your Health Magazine Contributor
4201 Northview Drive
Suite 102
Bowie, MD 20716
More Health Education Articles
How to Read Your Blood Test Results: A Plain-English Guide to Reference Ranges, Units, and Trends

You get a text saying your lab results are ready, you open the portal, and you are met with a wall of acronyms, tiny numbers, and the occasional red “H” or “L” that makes your stomach drop. For something that is supposed to tell you about your own health, a lab report can feel deliberately unreadable. The good news is that once you understand how the report is built, most of it becomes far less intimidating — and far more useful. Here is a calm, practical walkthrough of what you are actually looking at.
A quick note before we start: this article is educational, not medical advice. Lab values are one piece of a much bigger picture, and only a clinician who knows your history can interpret them for you. The goal here is simply to help you read your own report with more confidence and ask better questions.
The anatomy of a lab report
Almost every blood test report, regardless of the lab, is organized into the same handful of columns:
- Test name — often abbreviated (MCV, HDL, ALT, TSH). These are individual measurements, usually grouped into panels such as the CBC or a lipid panel.
- Your result — the number the lab measured for you.
- Reference range — the range considered typical for a healthy population, sometimes labeled “normal range.”
- Units — the scale the result is reported on (mg/dL, mmol/L, g/dL, and so on).
- Flags — a letter or highlight (H, L, or an asterisk) marking a value that falls outside the reference range.
Read left to right, one row is just: “here is a measurement, here is your number, and here is what is typical.” That framing alone takes a lot of the anxiety out of a first glance.
A reference range is not a pass/fail line
The single most common misreading is treating the reference range as a boundary between “healthy” and “sick.” It isn’t. A reference range is typically defined as the values seen in the middle 95% of a healthy reference population. By definition, that means roughly 1 in 20 perfectly healthy people will fall slightly outside it on any given marker — and a single flagged value is often meaningless on its own.
Ranges also shift with age, sex, pregnancy, hydration, the time of day you had blood drawn, and even the specific lab and instrument used. That is why the same result can be flagged at one lab and not another. A number just past the edge of the range is a prompt to look closer, not a diagnosis.
Why the units matter (and why they trip people up)
One of the most confusing parts of comparing results — especially across countries, apps, or older records — is that the same substance can be reported on completely different scales. Blood glucose, cholesterol, and triglycerides are commonly reported in mg/dL in the United States but in mmol/L in much of the rest of the world. A fasting glucose of “95” and one of “5.3” can describe the exact same blood sample; they are just different units.
This matters the moment you try to compare an old result to a new one, or a home-test reading to a lab report. Rather than doing the conversion math by hand (and the conversion factor is different for glucose, cholesterol, and triglycerides), it is easier to use a free tool that converts between mmol/L and mg/dL for each of those markers. Getting everything onto one scale first is the difference between a meaningful comparison and an accidental scare.
The CBC: your three cell lines
The complete blood count (CBC) is the panel people ask about most, partly because it has the most acronyms. It is easier to hold in your head if you group it into three “cell lines”:
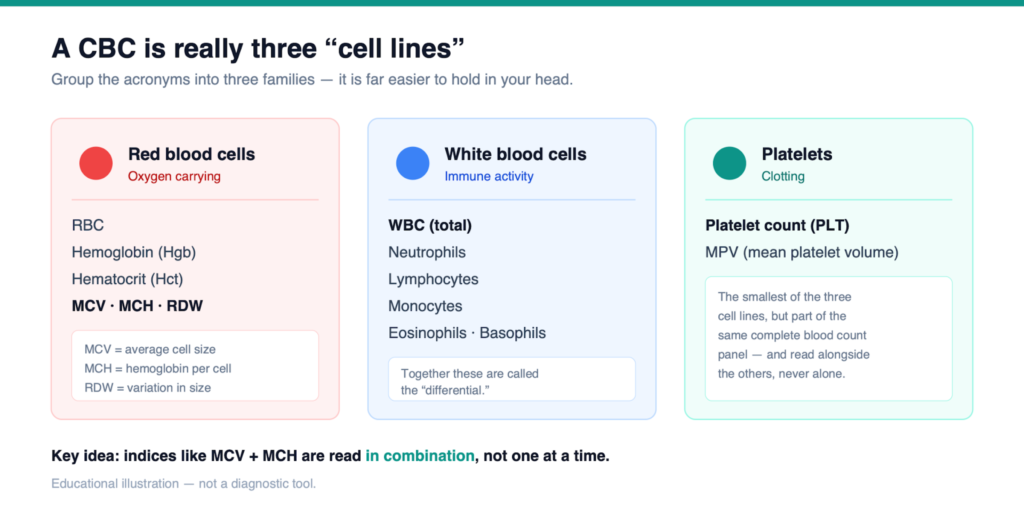
- Red blood cells — RBC, hemoglobin (Hgb), hematocrit (Hct), and the red-cell indices MCV, MCH, and RDW. Broadly, these relate to how well your blood carries oxygen.
- White blood cells — WBC and the differential (neutrophils, lymphocytes, and so on), which relate to your immune activity.
- Platelets — involved in clotting.
Here is the key insight: the individual indices are most informative in combination. For example, MCV (average red-cell size) and MCH (average hemoglobin per cell) are usually read together, and patterns like low MCV alongside low MCH tell a different story than either value alone. If you want to see how these patterns are commonly grouped, this plain-English breakdown of how common CBC combinations are read together walks through the frequent pairings without veering into self-diagnosis. Reading the panel as a whole, rather than hunting for a single red flag, is exactly how clinicians approach it.
One snapshot rarely tells the story — trends do
A lab result is a photograph of a single moment, and moments are noisy. Hydration, a hard workout the day before, a recent illness, fasting versus not fasting, and normal biological variation can all nudge a number. That is why a value that moved from the middle of the range to the edge is often less important than the direction and speed of change over several tests.
Whenever you can, look at the same marker across multiple dates. A stable value sitting slightly outside a reference range is usually far less concerning than a value that is climbing steadily within the “normal” range. Keeping your results in one place — a health app, a spreadsheet, or your provider’s portal — turns a pile of one-off reports into a trend line you and your doctor can actually use.
When to actually pick up the phone
Understanding your report should make you calmer, not turn you into your own diagnostician. A good rule of thumb: contact your clinician promptly for any result flagged as critical (labs call these separately for a reason), for values that are far outside the range rather than just past the edge, and for anything that lines up with symptoms you are experiencing. For a single marginal flag with no symptoms, it is usually reasonable to note it, keep the report, and ask about it at your next visit.
The takeaway
A lab report is not a verdict — it is a structured set of measurements with context attached. Once you can name the columns, treat reference ranges as guides rather than gates, get your units onto one scale, read panels like the CBC as combinations, and follow trends instead of snapshots, the whole thing shifts from anxiety-inducing to genuinely empowering. You do not need a medical degree to be an informed reader of your own results; you just need to know how the report is built — and to bring your questions, and your trend lines, to the professional who can put them in context.
Other Articles You May Find of Interest...
- How to Count Respirations in 15 Seconds
- The Best Time to Book Your Immigration Medical Exam to Keep Your Application on Track
- Are There Lymph Nodes in the Lower Leg?
- Why Blood Plasma Is Yellow
- How to Measure Respiration Rate Accurately
- Where Are the Pores of Sweat Glands Located?
- Why Event Medical Planning Matters More Than Most Organizers Expect